|
Preset analysis methods
|   |
|
Preset analysis methods
| |
|
Preset analysis methods in charts |
|
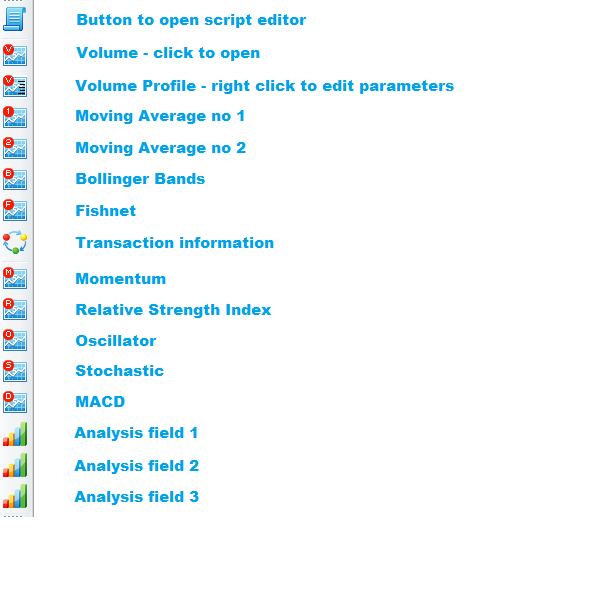
The button bar on the left are a number of preset analytical methods available that can be very helpful and good decision-making in trading. The most common and most widely used methods can thus be quickly turned on and off in the chart. |
|
|
|
|
Change parameters for preset analysis methods |
|
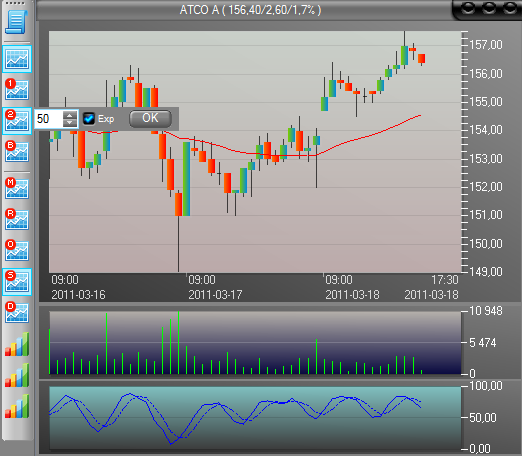
It's easy to change the current parameter values for the preset analysis methods. Right-click on the respective button so you can adjust to the desired value. Click OK when finished. Several methods can be turned on simultaneously, in the example below, the volume, Stochastic and Moving Average 2 enabled.
|
|
Adjust fields for preset analysis methods |
|
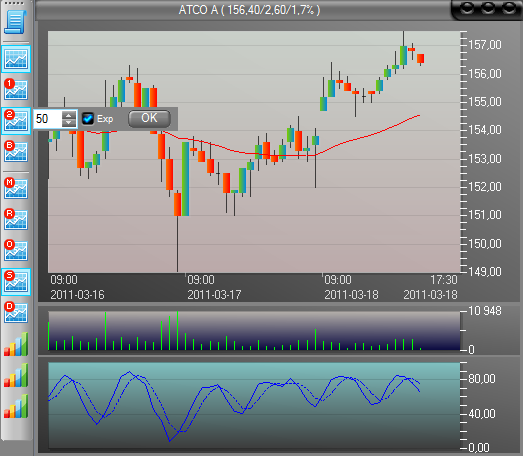
Moving averages and Bollinger Bands are plotted directly in the chart, while other analysis methods have their own analysis areas. Although these areas can be adjusted. For example, shifting the balance between Volume and Stochastic in the example above:
|
|
Moving average 1 and 2 |
|
Moving averages only have 1 main parameter - the number of periods (bars) that are used to calculate the average. This means the moving average will adapt to the resolution used in each diagram. For example, if EOD (daily bars) are selected in a diagram the moving averages will be calculated based on daily bars. If you select intraday resolution in the diagram, the moving averages also change to the new resolution. There is a check box to select Exponential weighting. |
|
Volume Profile |
|
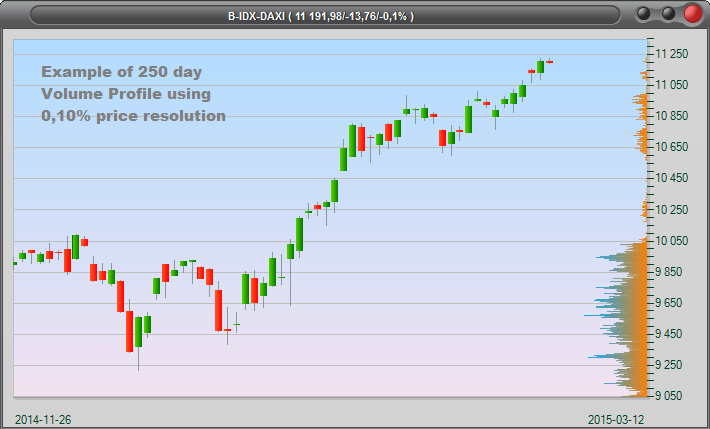
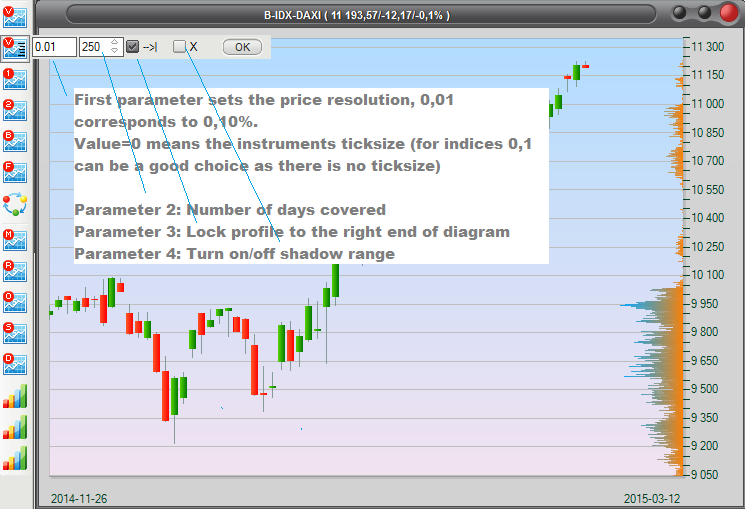
The volume profile has two main parameters, the first is the percent difference defining a new price range, for example 0.10 corresponding to each price range covering 0,10% (or the closest possible ticksize for each instrument). Setting this parameter to 0 means the price range will always be the instrument ticksize. Parameter no 2 is the number of days coveread. Check boxes: The first check box places the volume profile at the right end of the diagram. Uncheck to draw across the entire diagram. The second check box turns on/off the shadow range enabling to see how large the profile is.
|
|
Bollinger bands |
|
Bollinger bands have two main parameters, the first is the number of periods, the second the number of standard deviations used to calculate the bands. You can also select decimal numbers for deviation. |
|
Fishnet |
|
Fishnet have two main parameters, the first is the number of periods for the longest moving average used, the second determines how of many of all shorter moving averages should be displayed. For example, the setting 300,3 means that the longest average used is 300 bars, and every 3:rd average is displayed, this is to create some degree of "air" in the chart. |
|
Bollinger bands |
|
Bollinger bands have two main parameters, the first is the number of periods, the second the number of standard deviations used to calculate the bands. You can also select decimal numbers for deviation. |
|
Momentum |
|
Momentum has only one parameter, the number of periods used. |
|
Relative Strength Index |
|
Relative Strength Index, RSI, have three main parameteres. The first sets the number of periods used. The second sets the number of periods for the moving averages used to "polish" the RSI curve. The third is the number of periods for the moving average applied to the first moving average (parameter 2). This second moving average is often used as a trigger curve.
|
|
Oscillator |
|
The price oscillator have two main parameters for setting the two moving averages used. There is also a check box to apply exponential averages. |
|
Stochastic |
|
The stochastic oscillator use three parameters, the first is for setting the number of periods used. The second is the number of periods used for the moving average "polishing" the stochastic (value=1 equals no polishing). The third parameter is the number of periods used for moving average of the polished stochastic, often used as a trigger curve.
|
|
MACD |
|
MACD have three main parameters. The two first are used to set the number of periods for each moving average. The third is the number of periods for the moving average of the difference between the first two averages, often used as a trigger curve. Weighting is exponential. |