|
Calculation Explorer and screening |
|
The Calculation Explorer is a very powerful tool to filter out instruments that meet certain criteria you are looking for. For example, you can quickly get all the shares of one or more stock market listings that are doing better than the index just today and so on. It is often called screening - you simply scan through a large number of instruments and looking for certain conditions. The results are listed with options to sort and rank the various papers against each other. |
|
Conditions and opportunities |
|
The Calculation Explorer works only in daily time resolution, ie, daily bars in stock charts. All technical methods run in this resolution. But it is perfectly fine to run the Calculation Explorer at any time during a trading day and get the result as it looks "right now". In addition to the individual instruments that may be of interest to buy or sell, you can use the results of a spreadsheet as a general indicator for the expected development of the stock market in general. For example, one can compare the number of buy and sell candidates in several calculations and obtain a measure of how likely it is that the market goes up or down the next few days. |
|
Examples of results and interpretation |
|
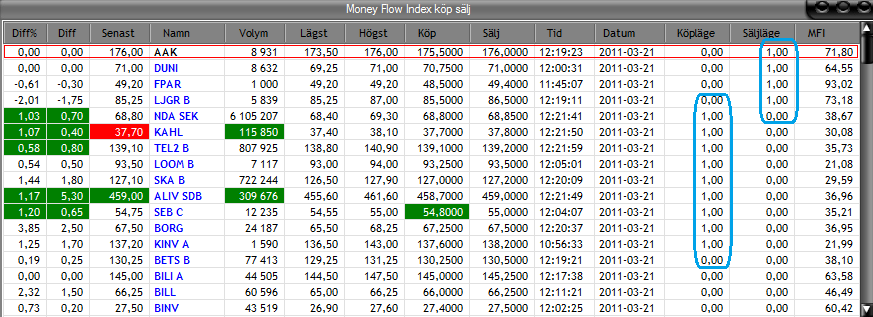
We use the example below, the list of results from calculation Money Flow Index Buy and Sell to get a measure of the stock markets anticipated development. The calculation presents both the buy and sell candidates according to the criteria we have chosen. By comparing the number of shares that have received abuy signal and sell signal we get a measure of the stock market overall expected direction:
By clicking on the columns Köpläge (for Buy) and Säljläge (for Sell) the instruments will be sorted accordingly and we can quickly conclude that there are nine buy candidates but only 4 sell candidates. It can be interpreted as the stock market can be expected to rise at least a day or more. Very useful for eg dealing in XACT Bull and Bear. |