|
Work with Analyzer results
|   |
|
Work with Analyzer results
| |
|
Analysis bench - displaying results in charts |
|
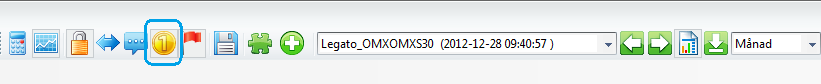
Om du gjort en simulering med periodvis resultatindelning kan du studera resultatet grafiskt. Vi antar att du öppnat ett resultatdiagram enligt punkten ovan. Markera analysbänkens resultatfönster och klicka därefter på knappen Visa vinstkurva i diagram.
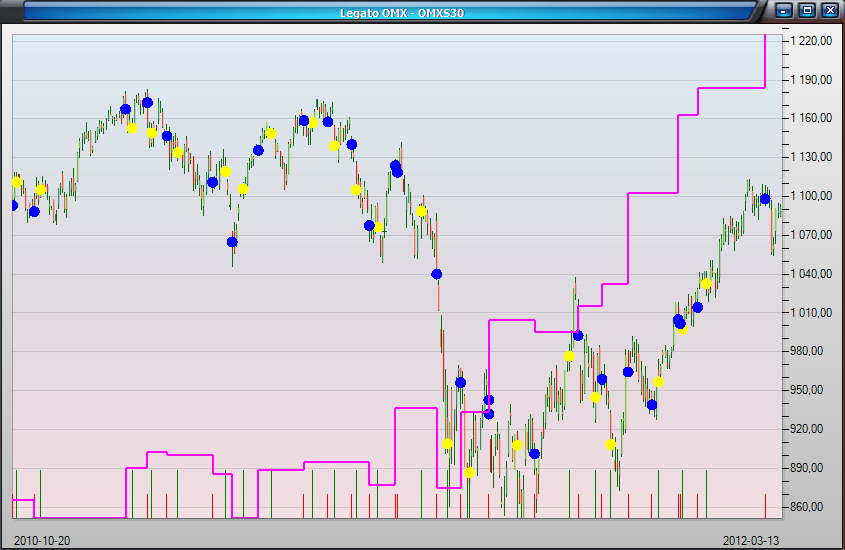
The profit graph is turned on. The curve is an effective way of seeing how a trading strategy performs in different markets. For example, if you see downward moves it is interesting to compare with the market itself during the period.
|
|
Analysis bench - browse through results |
|
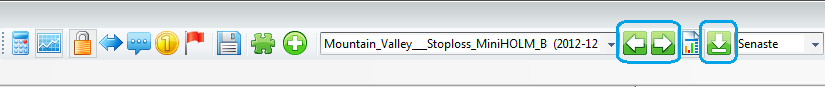
Whenever you have ran multiple simulations, or simulated order models with multiple instruments connected you can browse these result reports by clicking on the arrow buttons show below.
|