|
Navigating in charts
|   |
|
Navigating in charts
| |
|
Opening a chart |
|
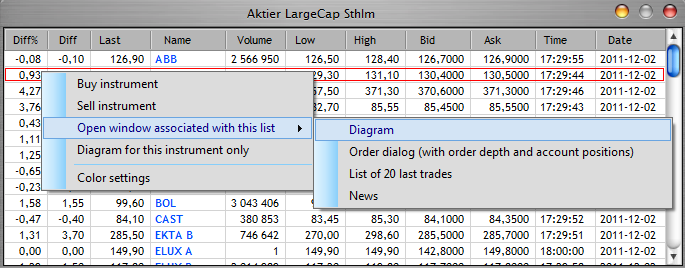
A useful feature is associating a chart with a instrument list in the workspace. This way you can let the charts alter as you double click on different instruments. In order to open an associated chart, right click in the instrument list and select Open window associated with this list > Chart
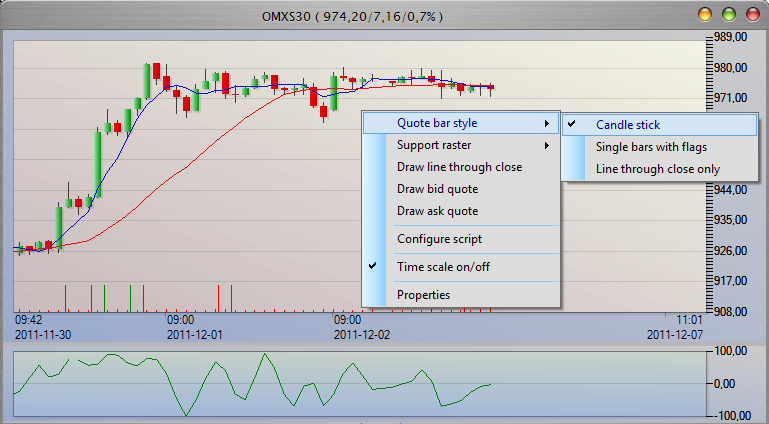
If you select chart, a chart will be opened that updates whenever you double click on another instrument in the list. You can have several charts opened simultaniously, for example in different time resolutions to maximize your market view. You can also change the appearance of the chart by right clicking and select Quote bar style >
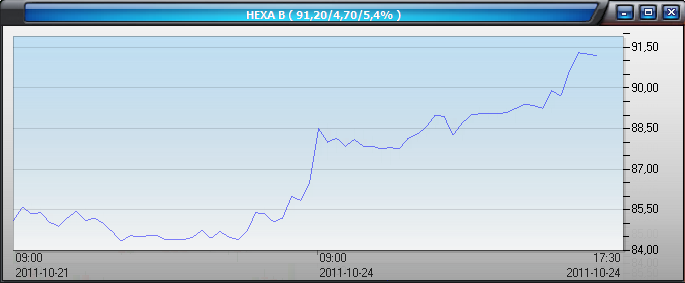
If you select Line through close only, and perhaps change the resolution of the chart, you can alter the look the way you like.
|
|
Navigating i charts |
|
To make the charts useful we need to be able to navigate, zoom in and out, move scales etc. This is easily done in Nordnet AutoTrader:
|
|
Zoom functions |
|
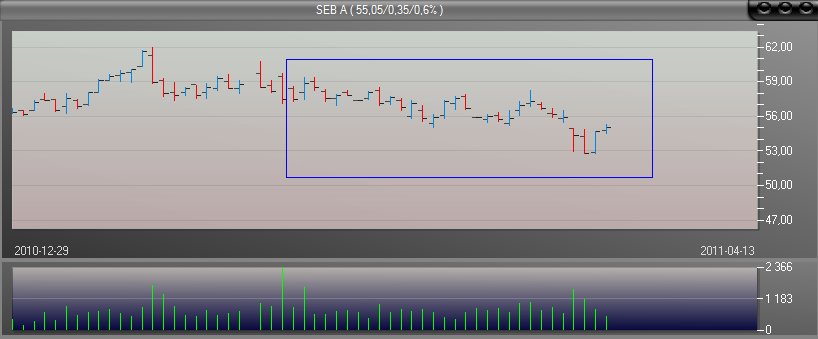
You can use the mouse wheel to zoom in and out of a chart:
|
|
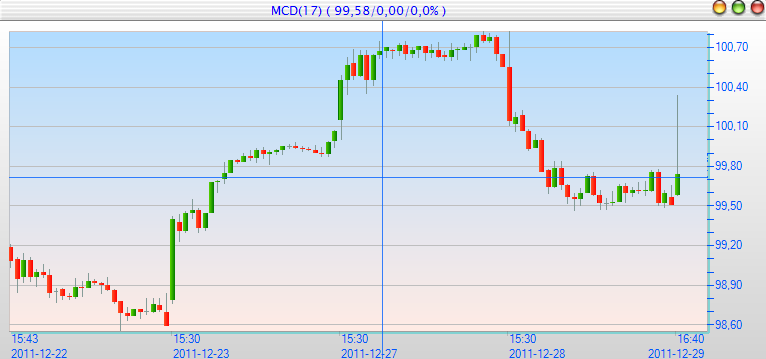
Time- and qoute marks in chart (hair cross) |
|
By pressing the right mouse button you get a hair cross that follows the pointer. This can be useful when you want to study a certain behaviour of an indicator at a specific time or similar.
|
|
Change parameters for new charts |
|
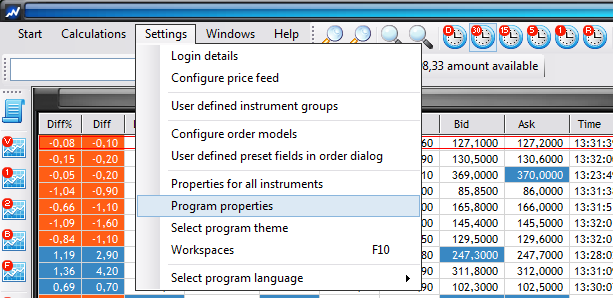
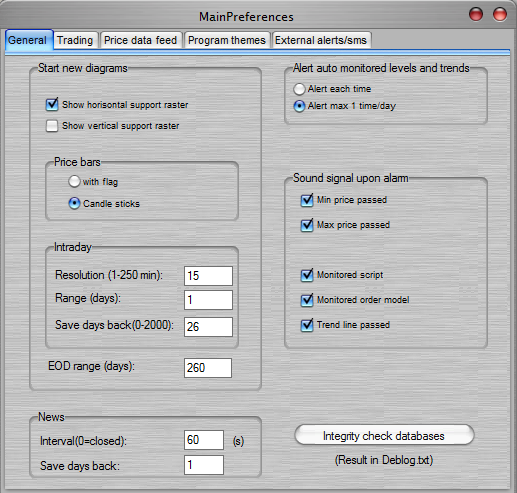
You can set what resolution and range a new chart should have upon opening. All resolutions from daily bars down to realtime ticks are available. The basic settings are available in the Settings > Program properties dialog.
As the dialog is opened you can set the chart properties. In the example below, new charts will be opened with 15 minute bars, 1 day of range and candle stick look. Horisontal support raster will be present. Daily charts are opened with 260 days of range. The properties can be altered also after the chart has been opened.
|
|
Change resolution and range of an already opened chart |
|
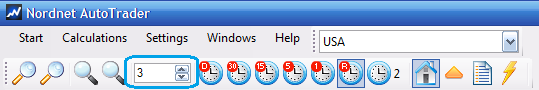
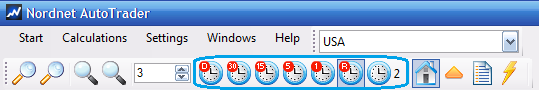
You can alter the number of days a chart will cover using the settings in the toolstrip:
You can alter the resultion using either the preset buttons or the user defined button:
To alter the value, simply right click on the button and step up or down. Then click on the time symbol to change the chart. The settings are stored individually for each chart with the workspace. |